spiced 12AX7
NB: The use of the software on this page is deprecated in favour of more recent development lines.
What Is This?
This page contains spice plots and analysis data documenting soft harmonic distortion and hard clipping as it occurs in the output node of a simple preamp stage model containing one 12AX7, a valve commonly found in instrument preamp stages.
Neither is this the simulation of a complete real instrument amplifier preamp stage, nor are the results and deductions claimed to be complete or even true to the real thing. Nevertheless, it is hoped that this analysis will give insights into the principles of valve-based amplification tone coloring and to give a foundation for a DSP implementation of similar sonic characteristics.
The spice netlist used to obtain these plots was taken from this page; modifications to the model during the process of this analysis are announced as they are applied.
Why?
Because it sounds good.
Notice
This work has been outdated by a more recent preamp simulation which recreates a preamp like it is actually found in instrument amplifiers.
Soft Harmonic Distortion
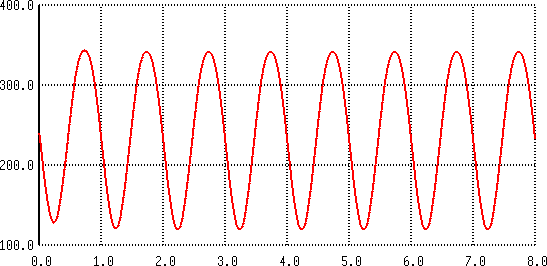
We'll start with the plot of the output voltage in an 8 ms simulation run, with the input signal a 1 kHz sine wave at an amplitude of 2V, which is close to the amplitude where the valve will start clipping due to the finite supply voltage. At this point, the circuit's harmonic distortion is assumed to be the most pronounced.
|
|
| Output Voltage over 8 ms for Vin = 2V |
There's nothing much to be deduced from the study of the waveform in this plot other than that the circuit moderately reduces the DC offset of the input signal.
We'll take a closer look at the data, aided by spice's fourier command:
No. Harmonics: 20, THD: 5.56295 %, Gridsize: 200, Interpolation Degree: 1 Harmonic Frequency Magnitude Phase Norm. Mag Norm. Phase -------- --------- --------- ----- --------- ----------- 0 0 236.795 0 0 0 1 1000 112.014 -175 1 0 2 2000 6.15831 99.2836 0.0549779 274.288 3 3000 0.758719 -167.48 0.00677342 7.52732 4 4000 0.501393 -76.571 0.00447615 98.433 5 5000 0.0229983 49.8592 0.000205316 224.864 6 6000 0.03878 -83.018 0.000346206 91.9866 7 7000 0.149622 -161.82 0.00133574 13.1869 8 8000 0.153184 108.659 0.00136754 283.663 9 9000 0.136587 21.9192 0.00121937 196.924 10 10000 0.0896132 -65.937 0.000800016 109.068 11 11000 0.0430878 -152.03 0.000384664 22.9766 12 12000 0.0056387 131.219 5.03392e-05 306.223 13 13000 0.0147968 -154.16 0.000132098 20.8439 14 14000 0.0195741 120.119 0.000174746 295.124 15 15000 0.0140638 31.4185 0.000125553 206.423 16 16000 0.00542198 -62.641 4.84044e-05 112.363 17 17000 0.00140694 81.0185 1.25604e-05 256.023 18 18000 0.0026102 -34.628 2.33023e-05 140.376 19 19000 0.000377796 57.1867 3.37275e-06 232.191 |
|
| Harmonic distortion over 8 ms of the output signal |
For the 10th harmonic we record an amplitude of -62 dB, the 15th comes at -78 dB.
To get an idea how the simulation error converges over longer simulation runs, we look at the same model, run in a 4 ms simulation:
Harmonic Frequency Magnitude Phase Norm. Mag Norm. Phase -------- --------- --------- ----- --------- ----------- 0 0 236.838 0 0 0 1 1000 111.985 -175.01 1 0 2 2000 6.16016 99.1752 0.0550086 274.183 3 3000 0.750173 -167.37 0.00669885 7.63536 4 4000 0.504372 -75.932 0.00450391 99.075 5 5000 0.0247499 45.5492 0.00022101 220.557 6 6000 0.0367601 -77.556 0.000328258 97.4513 7 7000 0.144581 -161.61 0.00129107 13.3992 8 8000 0.151514 107.496 0.00135298 282.503 9 9000 0.138637 21.5923 0.00123799 196.6 |
|
| Harmonic distortion over the first 4 ms of the above output signal |
The error is found to be sufficiently small to find the data reliable for DSP implementation purposes.
We check for fundamental frequency dependency by looking at the harmonic distortion of the same model for a 500 Hz sine wave:
No. Harmonics: 20, THD: 4.95494 %, Gridsize: 200, Interpolation Degree: 1 Harmonic Frequency Magnitude Phase Norm. Mag Norm. Phase -------- --------- --------- ----- --------- ----------- 0 0 237.204 0 0 0 1 500 105.272 -167.68 1 0 2 1000 5.16334 119.696 0.0490474 287.38 3 1500 0.493219 -147.49 0.00468517 20.1942 4 2000 0.508691 -42.743 0.00483214 124.941 5 2500 0.156109 -118.58 0.0014829 49.1044 6 3000 0.121501 159.88 0.00115416 327.564 7 3500 0.0219959 83.6658 0.000208943 251.35 8 4000 0.0208087 -179.68 0.000197666 -11.994 9 4500 0.0462616 102.121 0.000439446 269.805 10 5000 0.0457141 23.4853 0.000434246 191.169 11 5500 0.0323143 -55.193 0.000306959 112.49 12 6000 0.0127659 -133.63 0.000121265 34.0554 13 6500 0.00476529 -34.314 4.52663e-05 133.37 14 7000 0.0159176 -112.16 0.000151204 55.527 15 7500 0.0190177 169.127 0.000180652 336.811 16 8000 0.0152531 90.4079 0.000144892 258.092 17 8500 0.00742921 11.8249 7.05713e-05 179.509 18 9000 0.00106921 111.911 1.01566e-05 279.595 19 9500 0.00738784 34.3466 7.01783e-05 202.03 |
|
| Harmonic distortion statistics for a 500 Hz sine wave |
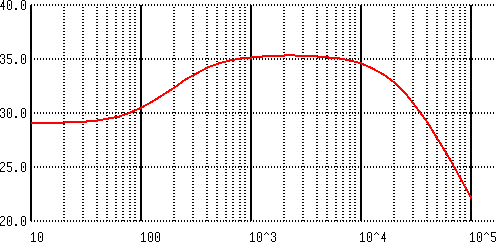
There seems to be a good deal of similarity to the distortion the 1 kHz signal experienced in the data points. From the 5th harmonic on, the difference between the two begins to differ more. The result could, however, also find a simple explanation in the circuit's frequency response, which an AC analysis reveals:
|
|
| Frequency response of the simulated circuit |
The frequency response is fairly linear between 1 and 10 kHz, which is suggesting that the harmonic distortion characteristics do in fact vary depending on the input signal frequency content.
Sawtooth response
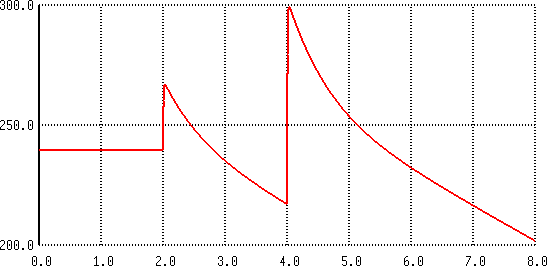
For a DSP implementation, it is interesting to know if we can emulate the distortion characteristics as a simple wave shaping transfer function. We feed the same circuit 2 ms of silence, then ramp the input linearly over 1 V over another 2 ms, and finally ramp over 2 V in 4 ms to get an idea:
|
|
| Sawtooth response of the simulated circuit |
The plot seems to suggest that a simple transfer mapping may indeed give good results if combined with the right sort of filtering.
Hard Clipping
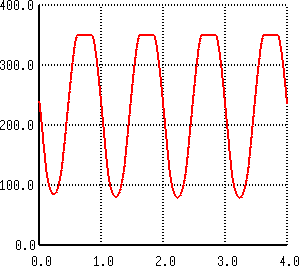
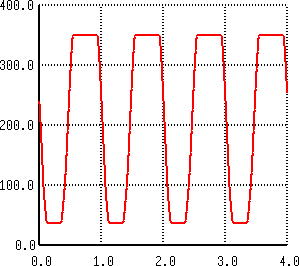
Let's now head on to the hard-clipping characteristics of this preamp simulation. We'll boost the input amplitude until it well exceeds the hard-clipping threshold(s):
|
|
| Output Voltage for Vin = 3V | Output Voltage for Vin = 6V |
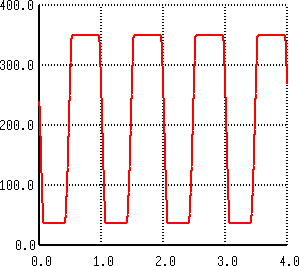
These plots are much simpler to read: the upper lobe of the signal is clipped much earlier than the lower lobe, and the top clipping threshold evaluates to about the supply rail voltage, which is what the author would expect.
For a DSP simulation of a complete amplifier, this means that the clipping threshold will probably vary if the power amplification stage is connected to the same power supply.
An additional run with the input amplitude boosted further to 10 V shows that the lower clipping threshold can be assumed a fixed value like the upper threshold:
|

|
| Output Voltage for Vin = 10V | Output Voltage for Vin = 6V |
The hard clipping will produce harmonic content rich enough to convince the author that a detailed analysis will be more fruitful when immediately combined with an effort to implement a DSP analogon.
The LADSPA unit
The author has written a LADSPA unit that implements naive hard clipping inspired by the study of these plots, without any aliasing protection measures though.
For an implementation of valve-like harmonic distortion of the softer kind, please be referred to Steve's valve and valve_rect LADSPA units.
Download
You may want to read the Gnu Public License that covers this plugin.
Installation
			$ tar xvfz clipper.tar.gz
			$ cd clipper
			$ make
			# make install
How to Use
The plugin only has one audio input and output port each, there are no parameters to set. Feed it a well-amplified guitar signal (the real fun starts at 30 dB) and route the output through a speaker emulation like unmatched to get a usable high-gain distortion tone.
Future versions of this plugin may or may not produce a different sound.